The powerful Omnis Debugger has just got even better in our latest release, Omnis Studio 10, with the addition of the ability to debug and test your code on a remote copy of Omnis. This allows you to debug your applications off-site, potentially saving you and your clients time and effort.
Remote debugging allows you to debug your Omnis code remotely over the network. You use a development copy of Omnis Studio, the remote debug client, to connect over the network to another copy of Omnis Studio, the remote debug server. The remote debugger itself is virtually the same as the “local” debugger all developers will be familiar with from existing versions of Omnis Studio, but with some important differences and additions. In summary, the key points to note about the new Remote debugging capability:
- The remote debug server runs the code that is to be debugged, and it can be any type of installation: development, fat client runtime, server or headless server, catering to your desktop, web & mobile applications.
- Omnis code running in the multi-threaded server, in server stacks other than the main stack, can be also debugged remotely.
- The remote debug server and client do not need to be running on the same operating system, so you can debug a Mac application on your Windows PC.
- The version of the client must be the same or later than the version of the server.
- Protected classes and locked libraries can be debugged remotely.
Although the term remote debugger is used, the remote debugger client and server can be on the same computer, and in fact the client and server can be the same Omnis process (in the latter case, the remote debug client runs with some restrictions).
Remote Debug Server & Client UI
The remote debug client and server connect to each other over a WebSocket. This applies even if the client and server are running in the same Omnis process. In the developer version of Omnis, you can configure the Remote Debug Server by clicking on the Omnis Studio (root) node of the Studio Browser tree, and clicking on the Remote Debug Server link. The Remote Debug Client is accessible via a new node in the Studio Browser tree, “Remote Debug Client”. It uses a similar session model to the Omnis VCS. When you click on the Remote Debug Client node in the tree, hyperlinks appear in the browser panel for Session Manager, and Open Session. You have to enable remote debugging in the library, and in the task instance (remote or standard for fat client), by setting the new $remotedebug property.
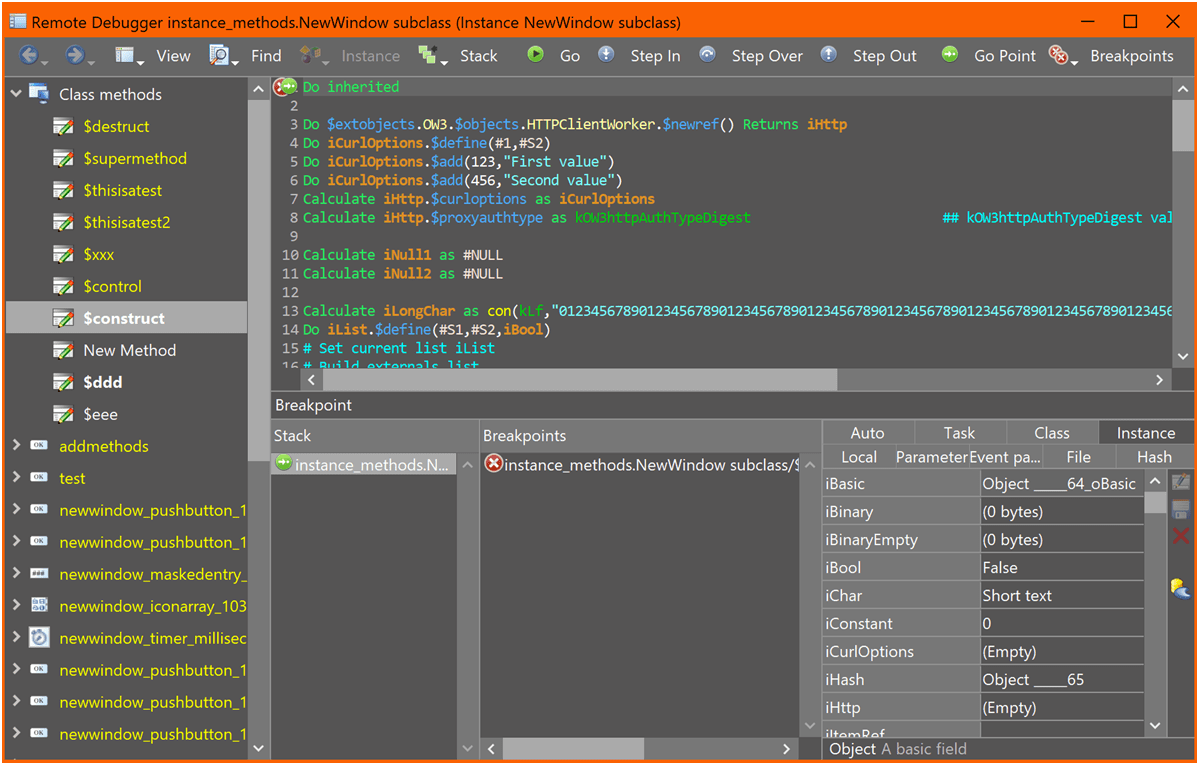
After configuring a session, you can click on the Remote Debug Client node in the Studio Browser tree, click on the Open Session hyperlink, and then click on the hyperlink for the session you want to use. After the session opens, libraries marked for remote debugging appear in both the browser tree and the browser panel. The remote debug window has a similar layout to the method editor. The main difference is that it always shows the debug panel (there is no editor panel), and in the bottom right-hand corner there is a new variable panel rather than the watch panel.
For more information about configuring & using the Remote Debugger, please see the Omnis Programming guide in the debugger chapter, here.