The purpose of most software applications is to store and manage data, and to then produce reports on that data, so you can instantly see a snapshot of that data and to make important decisions for your business or organisation. Omnis has many powerful reporting tools for collating, aggregating and presenting data, including very flexible charting tools. Omnis Studio provides two JavaScript Components chart controls: a Bar chart and a Pie chart that you can use to display data in a JavaScript remote form in your Web and Mobile applications in a browser. More complex chart types can be rendered using the Graph2 External Component, which you can display in windows and in reports on desktops, and on the web in a browser.
JavaScript Components: Bar & Pie Charts
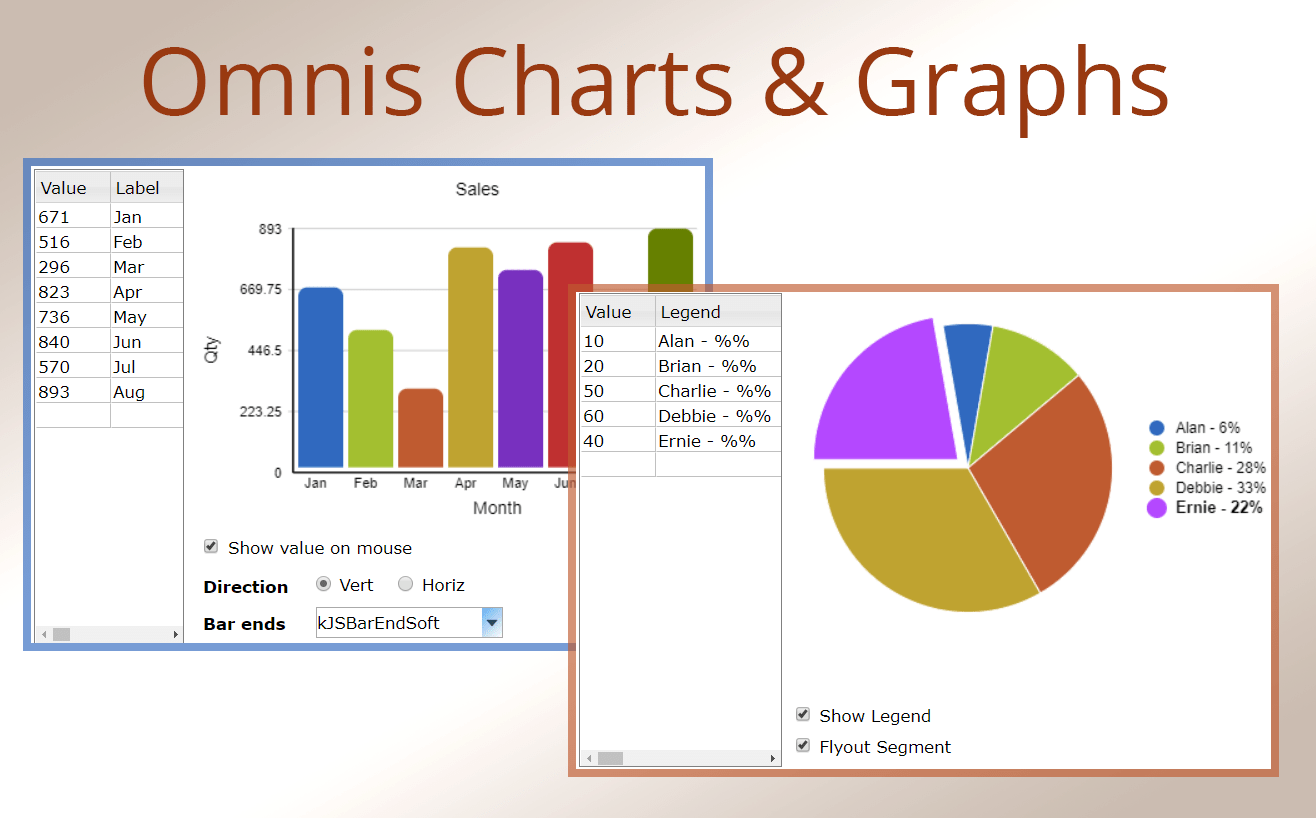
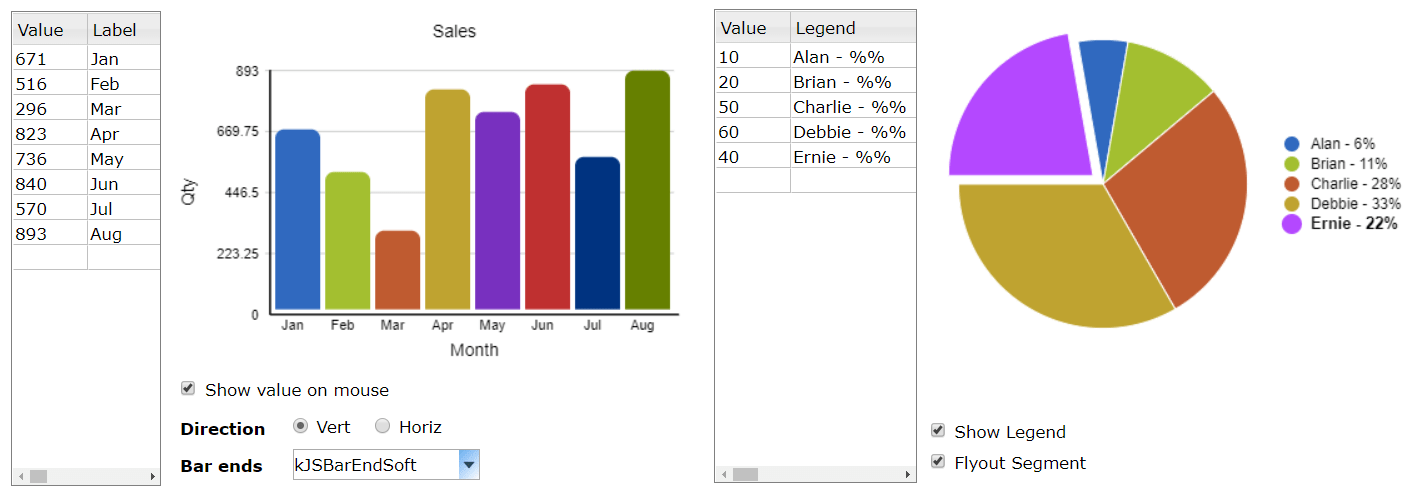
The data to be represented in the JavaScript Bar & Pie chart controls is contained in a list variable which is assigned to the $dataname property of the chart control – for the basic types, the list data can be a simple 2-column list, but for more complex charts the data has to be structured in specific ways to render all the data points in the chart. There is a sample app for both Bar and Pie charts in the JavaScript Apps Gallery on the Omnis website (tinyurl.com/jsgallery10 – scroll to ‘Bar chart’ or ‘Pie chart’), and available in the Samples section in the Hub in the Studio Browser when you first start Omnis Studio.
List data structure
To draw a simple bar or pie chart in the JavaScript Client, the list variable assigned to the $dataname property of the JavaScript component needs to contain at least two columns. The first column contains the value for the data point, and the second column contains the label or name for the data point. For example, to render the pie chart shown above, showing a list of figures for sales agents, you could use the following method, added to the construct method of the remote form:
; create instance vars iData (List), iValue (Int 32), iLegend (Char)
Do iData.$define(iValue,iLegend)
Do iData.$add(10,’Alan – %%’)
Do iData.$add(20,’Brian – %%’)
Do iData.$add(50,’Charlie – %%’)
Do iData.$add(60,’Debbie – %%’)
Do iData.$add(40,’Ernie – %%’)
The Bar and Pie chart components are further described in the online docs here.
Graph2 External Component
The Bar and Pie Chart JavaScript components provide a very quick and easy method to display some data in a remote form, but Omnis provides a further option to create more complex charts and graphs, the Graph2 External Component, which you can use in Window & Report classes for desktop applications, or you can use the Graph2 object to create charts in memory and present them in a JavaScript remote form. The latter method is used in the Picture sample app in the JavaScript Apps Gallery on the Omnis website (tinyurl.com/jsgallery10 – scroll to ‘Picture’), and available in the Samples section in the Hub.
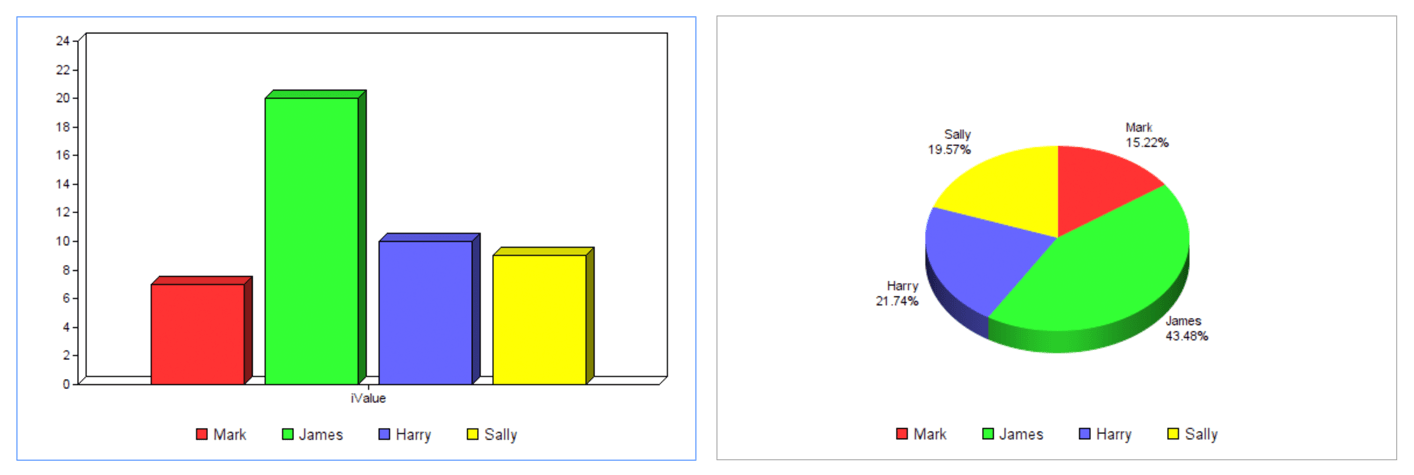
In this case, the chart is created in memory and the chart ‘image’ binary is assigned to a Picture control on the remote form.
# create instance vars: iData (List) containing the list data, built in the construct
# iGraph (Binary) assigned to $dataname of the picture control
# iGraphObj (Object) Graph2 is the subtype
Do iGraphObj.$majortype.$assign(iGraphType)
Do iGraphObj.$3d.$assign(kTrue)
Do iGraphObj.$dataname.$assign(iData) Returns #F
Calculate lHeight as pHeight
Calculate lWidth as pWidth
Do iGraphObj.$snapshot(lWidth,lHeight) Returns lSnapShot
Do pictformat(lSnapShot) Returns lPicFormat
Do pictconvto(lPicFormat,lSnapShot,’png’) Returns iGraph
Calculate iGraph as bytecon(iGraph,””)
The Graph2 external component allows a high degree of flexibility for charting your data and many 1oos of variations are available. The component is documented online here.
Download a Free Trial of Omnis Studio 10.1
If you would like to try out all the chart & graphing options in Omnis Studio, you can download the latest version and register for a free 90-day trial:
https://www.omnis.net/developers/free-trial/