Deeper Mysteries of Graph2
By David Swain
Polymath Business Systems
As database programmers, we are
so often immersed in the minutia of storing and retrieving data
that we sometimes forget the uses that our end users must
make of that data and the information they need to glean
from it. For example, most developers I have encountered over the
years seem to address the issues of generating reports for an application
only after the rest of that application has been built
rather than making that ultimate use of the application the focus
of their design. This practice only makes the reporting features
of the application that much more difficult to realize.
Reports are one important way to help the end user filter out and
make sense of momentarily significant collections of records. The
generation of lists is another useful way of presenting the user
with a focal set of data. But generating line upon line of printed
or listed data is only the first step toward analyzing
that data. The larger the data collection, the more difficult it
is for the end user to grasp its meaning or to see subtle trends
that can help them make intelligent plans for the future direction
of their business.
Graphing is an essential part of any business-related database
application. Converting masses of numerical data into a graphical
form for analysis helps to highlight important information for the
human decision-maker that might otherwise be hard to find - or be
completely overlooked.
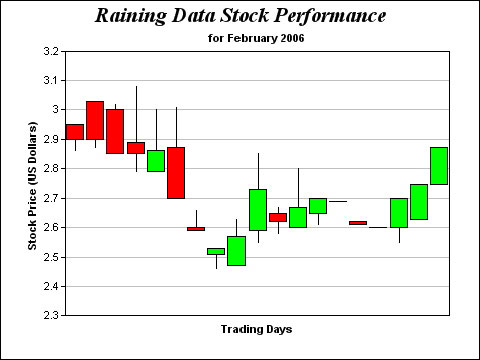
Consider the following set of data:
| Date |
High |
Low |
Open |
Close |
| 1-Feb-06 |
2.95 |
2.86 |
2.95 |
2.90 |
| 2-Feb-06 |
3.03 |
2.87 |
3.03 |
2.90 |
| 3-Feb-06 |
3.02 |
2.85 |
3.00 |
2.85 |
| 6-Feb-06 |
3.08 |
2.79 |
2.89 |
2.85 |
| 7-Feb-06 |
3.00 |
2.79 |
2.79 |
2.86 |
| 8-Feb-06 |
3.01 |
2.70 |
2.87 |
2.70 |
| 9-Feb-06 |
2.66 |
2.59 |
2.60 |
2.59 |
| 10-Feb-06 |
2.53 |
2.46 |
2.51 |
2.53 |
| 13-Feb-06 |
2.63 |
2.47 |
2.47 |
2.57 |
| 14-Feb-06 |
2.85 |
2.55 |
2.59 |
2.73 |
| 15-Feb-06 |
2.67 |
2.58 |
2.65 |
2.62 |
| 16-Feb-06 |
2.80 |
2.60 |
2.60 |
2.67 |
| 17-Feb-06 |
2.70 |
2.61 |
2.65 |
2.70 |
| 21-Feb-06 |
2.69 |
2.69 |
2.69 |
2.69 |
| 22-Feb-06 |
2.62 |
2.61 |
2.62 |
2.61 |
| 23-Feb-06 |
2.60 |
2.60 |
2.60 |
2.60 |
| 24-Feb-06 |
2.70 |
2.55 |
2.60 |
2.70 |
| 27-Feb-06 |
2.75 |
2.63 |
2.63 |
2.75 |
| 28-Feb-06 |
2.87 |
2.75 |
2.75 |
2.87 |
What trends do you see in this? Is it easier to view this way?
Graphs are not just for PowerPoint (or Keynote) presentations.
They are useful tools for examining numerical data - especially
when there is lots of it - because it is easier for most of us humans
to see and understand pictures than it is to glean subtle details
from massive numbers of numbers. There are many opportunities within
most database applications to make life easier for the end user
by offering the option to display listed data in graphical form.
In the previous article, we dealt with mainly "surface"
features of the Graph2 component. We examined how we set up a list
variable to be used by the component, how to set various properties
to achieve a certain "look" for a graph, etc. This time
we will dig a little deeper into the workings of this component.
But first, some important Omnis Studio 4.1 setup information for
Mac OS X users...
The Studio 4.1 Mac OS X Installation Shell Game
This past month I received communications from a number of Mac
OS X Omnis Studio developers saying that they could not get the
locked demo of my Graph2Lab product to open or that their copy of
Omnis Studio would crash when attempting to place a Graph2 component
on a window class in their own library. As far as I know, this is
only a Mac OS X issue and it is easily solved.
If neither you nor your end users work on the Mac OS X platform,
this issue will not concern you. It has nothing to do with the functionality
of Graph2, but there are some issues with how certain things must
be set up on Mac OS X that give many people problems with even following
the examples in these articles. If your libraries that contain a
Graph2 component will never be opened in Mac OS X, these problems
will be meaningless to you. On the other hand, if you intend to
deploy a library containing Graph2 on Mac OS X, you need
to know this information.
Graph2 Events
There are only two event types that are specific to the Graph2
component: evGraphClick and evPreLayout. Certainly
there are other events to which a Graph2 window object will react,
but these two apply only to the Graph2 field type and require special
mention in this article.
The evGraphClick event is a special kind of click event
used only for this component. In fact, a Graph2 window object does
not generate a normal evClick event, so that event variable
is not included in the event code selection list for the On...
command for this field type. A Graph2 component does generate
evMouseDown and other mouse events if the detection of
mouse events is switched on for it (even though these events are
not presented in the selection list either), but a common evClick
event is not in the repertoire of a Graph2 object.
But the evGraphClick event does not simply mean that the
user has clicked on the Graph2 object. Many clicks on a Graph2 field
will not register as "graph clicks". The only
time this event is generated is when the user clicks on a data
element of the graph image on the Graph2 object. While the
original Graph component allows us to also detect clicks on titles,
axes, grid lines and even on the background of a graph field, Graph2
simplifies the programmer's role in the process of "drilling
down" into the data behind the graph by only generating an
event when a data element receives a click. Further good news is
that this feature is always active as long as the Graph2 field is
active. We do not have to switch it on as we do with the $selectobject
property of the original Graph component.
In order to better define the specific graph click event, evGraphClick
is accompanied by four event parameters: pSet, pSetname,
pItem and pItemname. If we substitute "Group"
for "Set" and "Series" for "Item",
we are well on our way to understanding what these parameters tell
us. pSet and pItem report the column
and line number of the data element that received the graph
click. pSetname and pItemname report the labels
associated with that column and line. This allows us to determine
the corresponding cell within the data list for the element receiving
the graph click and to consistently label or describe any values
we might report back to the user as a result of such a click.
Responding to a graph click is only an issue with Graph2 fields
on window instances. Reports are not interactive, so a Graph2 object
on a report cannot react to a click. Remote forms do not have Graph2
fields, but can only display pictures generated using the $snapshot()
method of a non-visual Graph2 object in Remote Form Picture fields.
But those Picture fields have been somewhat enhanced in Studio 4.1
in anticipation of another feature of Graph2, which we will touch
on briefly later in this article.
The above is a description of how the evGraphClick event
is supposed to work. At least, this is the theory
behind the evGraphClick event. The results I have been
able to achieve in practice so far have not fit the theory very
well, but these issues have been reported to the proper people and
may very well be fixed with the next release of Omnis Studio.
This is the end of the "bad news" portion of this article.
Everything from here forward is good news!
An event that does work as described - and is quite useful
as well - is the evPreLayout event. The evPreLayout
event is somewhat unusual in Omnis Studio. It is triggered whenever
the graph is being constructed. (Like the evImagePluginCreate
and evXCompPluginCreate events of the HTML control
field - but maybe you aren't familiar with those either...) This
occurs both during the construction phase of the window instance
and as a result of the execution of the $dispose() method
of the Graph2 object.
The primary purpose of this event is to allow us to use the $add***layer()
methods of the Graph2 component to build up a composite graph image
by layers. But before we can use this event, we must also understand
those methods (and vice versa)...
Graph2 Layer Methods
In the last article, we discussed the difference between the $redraw()
and the $dispose() methods for the Graph2 component. We
also examined how to use the $getcolors(), $setcolors()
and $snapshot() methods.
But there just wasn't time nor room to also cover the $add***layer()
group of methods in that article as well. As the names suggest,
these methods are used to build additional layers onto the graph
portion of a Graph2 object. Each new layer is placed behind
the existing layers, just as each new series is placed behind its
predecessors on an area chart.
We can only add layers of the same general type as the graph itself.
So we cannot add a Polar layer to an XY chart. But we can
add different kinds of XY layers to an XY chart - or different kinds
of Polar layers to a Polar chart. (Only one kind of Pie chart has
been exposed to us in the current Graph2 implementation. We cannot
add Pie layers, so we have not been given such a method for Pie
charts.)
For XY graphs, we can add the following types of layers:
| Layer Type |
Method |
| Line |
$addlinelayer(lList) |
| Bar |
$addbarlayer(lList) |
| Area |
$addarealayer(lList) |
| Scatter |
$addscatterlayer(lList[,iSymbol,iSymbolsize]) |
| High Low Open Close |
$addhloclayer(lList) |
| Box Whisker |
$addboxwhiskerlayer(lList) |
| Candlestick |
$addcandlesticklayer(lList) |
| Trend |
$addtrendlayer(lList) |
For Polar graphs, we can add the following types of layers:
| Layer Type |
Method |
| Line |
$addlinelayer(lList) |
| Area |
$addarealayer(lList) |
| Spline Line |
$addsplinelinelayer(lList[,iSymbol,iSymbolsize]) |
| Spline Area |
$addsplinearealayer(lList[,iSymbol,iSymbolsize]) |
Notice that all of these methods require their own data list as
a parameter. This list acts just like the one we use in the $dataname
property for the Graph2 object itself, but these are completely
different lists of values (and can be different variables). The
list simply has to be structured correctly for the type of graph
the layer will create. The first column will always be the Series
name, for example.
The layout for each layer (portion of graph alloted to each XY
group, how that area is divided for individual series bars, etc.)
is determined by the shape (number of lines and columns) of the
list supplied. Graph2 does not enforce any rules that the list for
each layer of a given field must be the same shape. We must police
this for ourselves - or let our creative juices flow...
Some mixtures of graph type work well together, while others do
not. For example, we can use a Line layer to connect the closing
value of a Candlestick or HLOC graph and the data points on the
line will exactly overlay the point where the Close indicator meets
the vertical line that indicates the High-Low range. But if we try
to impose a Line layer over a Bar graph with multiple series, the
data points of the line will be placed at the center of the area
used by each group - and not in the center of the top of
each bar. This is because the layers are independent of one another,
so a Line layer knows nothing of the Bar graph in front of it or
of the horizontal positions allocated to the series elements within
a group. Adding layers is very different from telling a Bar graph
to connect the tops of the risers for a series, as we can do with
the original Graph component.
Also notice in the tables above that $addscatterlayer(),
$addsplinelinelayer() and $addsplinearealayer()
methods give us the option of specifying the symbol used for data
points added by that layer, as well as the size of symbol to be
used. (Curiously, the $addlinelayer() methods do not...)
The symbol must be specified using one of the constants supplied
with Graph2, but we can also use their numeric equivalents. Here
are our options:
| Constant |
Value |
| kG2symbolNone |
0 |
| kG2symbolSquare |
1 |
| kG2symbolDiamond |
2 |
| kG2symbolTriangle |
3 |
| kG2symbolRightTriangle |
4 |
| kG2symbolLeftTriangle |
5 |
| kG2symbolInvertedTriangle |
6 |
| kG2symbolCircle |
7 |
| kG2symbolCross |
8 |
| kG2symbolCross2 |
9 |
This is also the order in which these symbols are automatically
used in a "normal" scatter plot. With an XY Scatter graph,
we have no control over which symbols are used. But if we build
our graph one Scatter layer at a time, we can choose any of the
nine symbols provided for any layer - we just have to plot only
one series per layer.
If we want to add layers in addition to the main graph built using
the list variable named in $dataname, no problem! The first
layer will simply be placed behind the original graph. But if we
want to build our graph entirely with layers, we need at
least the skeleton (structure) of a graph from the basic data list
in order to have group titles appear on the graph. There are currently
other limitations to such a graph. The main limitation is that we
will see no legend if there is not at least one series in the base
graph. The contents of each layer will add elements to the legend,
but only if it exists in the first place.
So how do we go about adding a layer to a graph? We simply execute
one or more $add***layer() methods during the evPreLayout
event. We must supply an appropriate list variable as the first
parameter of the method for each such execution. Suppose that we
have a Graph2 field set up to present an XY Line graph and we want
to build it using layers. Here is a simple example:
On evPreLayout

                  Do dummyList.$copydefinition(dataList)

                  Do dummyList.$add()

                  Do dummyList.1.$assignrow(dataList.1)

                  Calculate graphObjRef.$dataname as nam(dummyList)

                  Calculate layerList as dummyList

                  Do layerList.1.$assignrow(dataList.2)

                  Do $cfield.$addlinelayer(layerList)
Here layerList is a local List variable. dataList
is the main source of values for our graph. dummyList is
a substitute for the dataList as the source for the main
graph as a means of assuring that the group labels and the legend
will be included in the resulting composite graph. This works fine
for a line graph where one layer cannot obscure another layer. But
for Bar and Area graphs, we may want to stack the layers.
For this, we have to be a little more clever...
Building a Stacked Bar Graph
There are many situations in which we might want to add graph layers.
One of these, which at first appeared to be a glaring omission within
the Graph2 repertoire, is for the creation of a stacked
graph. This is a graph that displays the values for all series for
a group as an accumulated value, but then displays striations whose
sizes are determined by the individual series values. Here is an
example of a stacked XY Area graph:
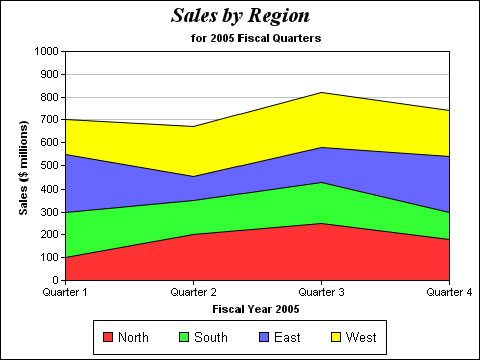
This kind of chart allows us to easily see the overall value for
each group and to see the relative contributions of each series
entry to that total. It is more difficult to determine the absolute
contribution of any series past the first one with this type of
chart, but for that we would use a simple bar chart (which, in turn,
makes it more difficult to determine the overall total for a group).
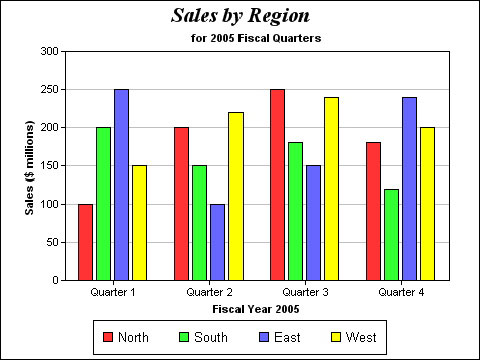
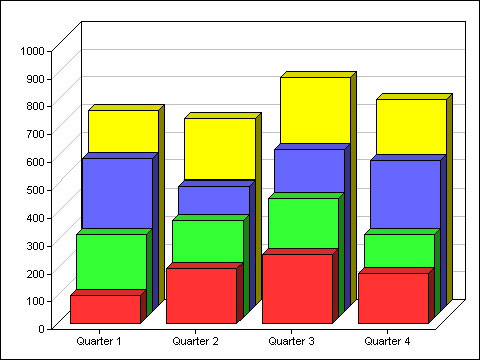
Let's suppose that we would like to stack the bars of this graph
rather than show them as separate bars so that we can better determine
the composite sales for each quarter as well as seeing the relative
contributions of each region. That graph would look like this:
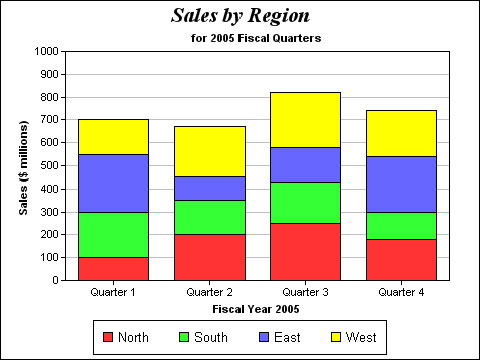
Notice how each bar in the stacked graph takes up the entire area
(width) for the group, while this area is split among the various
series in the simple bar graph. As long as the shape of the list
supplied for each layer is the same, the width and position of each
bar in corresponding layers is also the same. Note also how the
Graph2 object automatically adjusted the scale of its Y-axis to
accomodate the composite bar height. That is because this aspect
of the graph is determined once all the layers have been defined
during the evPreLayout event.
The secret to generating a graph like the one above is that our
code must accumulate values for each successive layer.
That is, each layer must represent a single series, but each group
value in that series must be the value for the current series plus
the sum of the values of the series that have already been graphed.
If we were to look at this graph in a 3D oblique view, this will
become clearer:
The series 1 values were used as is. But the series 2 layer displays
the sum of series 1 plus series 2 for each group. The series 3 layer
adds the series 3 values to that total, and so on. All we need is
some code to generate those cumulative values for each group. But
what if we don't know in advance how many series or groups will
be involved? We can determine this as we go. Let's examine the code
I have built to perform this operation first, then we'll break it
down:
On evPreLayout

                  Do dummyList.$copydefinition(dataList)

                  Do dummyList.$add()

                  Do dummyList.1.$assignrow(dataList.1)

                  Calculate graphObjRef.$dataname as nam(dummyList)

                  Calculate layerList as dummyList
    Calculate linecount as dataList.$linecount


                  For line from 2 to linecount step 1

                      Calculate layerList.1.1
              as dataList.[line].1

                      Do layerList.$cols.$sendall(layerList.1.C[$ref.$ident].$assign(

                              $ref+dataList.[line].[$ref.$ident]),$ref.$ident>1)

                      Do $cfield.$addbarlayer(layerList)

                  End For
First, we deal with our dummyList variable as detailed
in the previous section. Then we set up the layerList variable
as a copy of dummyList to begin the process. We also determine
how many lines are contained within dataList and hold that
value in the local variable linecount. Now we enter a For...
loop using another local variable, line, as our counter.
This value represents the dataList line (and graph layer)
we are currently processing. Notice that we begin this loop on the
second line of dataList. For each line we encounter,
we copy the Series name into column one of layerList. We
then execute the most complex line of code in this example to accumulate
the values from the current line of dataList with the corresponding
column values already in layerList. After our series values
have been updated for the current layer, we add that layer to the
graph.
While this is a bit more work than having a straightforward stacked
bar graph data type (as does the original Graph component), it isn't
so much more work that we could call it "difficult". As
with most things Omnis, it's just a matter of understanding how
the basic tools work!
Coordinate Positions and Graph2 Elements
As mentioned earlier in this article, we cannot directly place
a Graph2 object on a Remote Form. The Graph2 library does not contain
such a component - only Window, Report and (non-visual) Object components.
But we can create an object variable using the non-visual Graph2
Object component and make use of a new feature of a Remote Form
Picture field added to Studio 4.1 primarily for use with Graph2-generated
graph images.
The evClick and evDoubleClick events of a Remote
Form Picture field have been given two new event parameters:
pMouseX and pMouseY. These return the horizontal
and vertical position of the mouse, measured from the upper left
corner of the Picture field image (that is, excluding any
borders) at the time the event took place. These measurements are
in pixels. We can then apply these values as parameters of another
method of the Graph2 Object variable (back on the server) that can
determine which data element, if any, of the graph in the image
was clicked upon. That method is the $findobject() method.
The $findobject() method of a Graph2 Object requires four
parameters. The first two are the X and Y coordinates of
a point within the Graph2 image. The third and fourth parameters
are passed by reference, so they each receive a value as the result
of executing the method. They must be variables of numeric type
(they will be given Integer values) and they return the Set
(Group) and Item (Series) numbers
respectively of the data element in the graph that covers the point
specified by the first two parameters. The return value of this
method is a Boolean value that indicates whether the click was on
a data element. If not, it returns kFalse - but it returns
kTrue (and non-zero values for the variables named as third
and fourth parameters) if the point coordinates given do, in fact,
hit a data element. Think of the execution of this method as a notational
"graph click".
There are optional fifth and sixth parameters for the $findobject()
method as well. These are also passed by reference and must be Character
variables. They return the Set (Group) and Item
(Series) names (labels) associated with
the data element at the point specified by the first two parameters.
So this method is able to return up to five useful pieces of information
based upon two supplied values.
Obviously, this method and the new event parameters for a Remote
Form Picture field are meant for each other. But we can also use
those event parameter values as a sort of image map coordinate for
other purposes (although the HotPict component is probably a better
choice for that).
Graph2 Text Tags
One final tidbit to pique your curiosity - and to solve some serious
problems for those people who must use special fonts for non-Roman
alphabets. Consider this the "dessert course", if you
will. In the previous article on the Graph2 component, I stated
that we have no control over the fonts or other text properties
used in titles and other text-bearing elements of a Graph2 graph.
It turns out that this is not entirely true. What is true
is that there are no font-related properties of the Graph2
object. But what is also true is that there is a rich and
robust system of tags that we can use within the values
of text-bearing properties and other labeling content of a graph
that allows us to do some pretty impressive things with text on
Graph2 fields.
If the term "tag" is unfamiliar, let me briefly explain:
A tag is a string (like the escape sequences we explored
when we studied styled text a couple of years ago) that is used
to specify attributes for a range of characters in a string value.
Tags are separated from the text in which they are embedded by using
a special sequence of characters to denote the beginning and end
of the tag. For example, HTML tags begin with < and end with
>.
Graph2 tags are similar to HTML tags. But Graph2 tags are signaled
using the character combinations <* and *> to indicate the
beginning and end of the tag. Within the tag, specific text properties
recognized by Graph2 are given values in a propertyname-value pair.
This specification takes the form:
propertyname=value
Unlike HTML tag parameters, no quotes are used to enclose
the value string. In this article, we are only concerned with font
tags, but there are other types as well. The basic form of a font
tag is:
<*font=fontname*>
The word "font" is the name of the property and we assign
it the name of a font file that is installed on our computer. There
are some platform differences in which kinds of fonts can be used.
We can use TrueType (.ttf), PostScript Type 1 (.pfa and .pfb) and
Windows bitmap fonts (.fon) on the Windows platform. On Mac OS X
we can use TrueType, OpenType, PostScript Type 1, Data Fork and
even Font Suitcase fonts. We can also use Mac OS X Font Manager
names if we prefer.
There are also some assumptions made as to where the fonts will
be found. On Windows, Graph2 looks for .ttf files in the \Fonts
directory of the main Windows installation. On Mac OS X, it looks
in /Library/Fonts and /System/Library/Fonts. There
are also ways to tell Graph2 to look in other directories, but this
should be enough for right now.
So to specify that we want to use the Arial TrueType font, we would
use:
<*font=arial.ttf*>
Once we have established that this is a font tag by using the font
property, there are other font-related properties we can specify
in the tag as well. For example, we can use the size property
and specify the font size in points. So to specify 18 point Arial,
we would use:
<*font=arial.ttf,size=18*>
The font tag must be included in the property value before the
character string that it will affect. If our main title is "Sales
by Region" and we want to display it in 18 point Arial, then
the value we must give to the $maintitle property is:
"<*font=arial.ttf,size=18*>Sales
              by Region"
One other property that you may find useful is that we can override
the default text color (assigned using the value in the third line
of the color list for the Graph2 field) by specifying the color
property value. This must be given an rgb color value as
a hexadecimal string (but without the initial # character we would
use in HTML). So to add a red text color to our main title, we would
use:
"<*font=arial.ttf,size=18,color=FF0000*>Sales
              by Region"
Tags like these are usually hidden from the end user in most applications,
but not so in Graph2. If we want to shield this programmer trivia
from our end users, we must build an interface that allows the user
to make font, size, color and text specifications without seeing
the actual syntax of the finished property value.
Here is a simple example of what we can now achieve in Graph2:
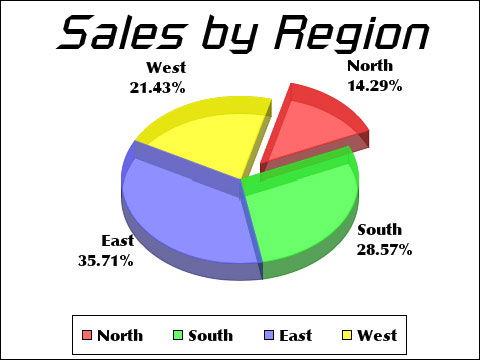
Here we see a Graph2 Pie chart where the main title was given the
Russell Square Oblique font at a size of 36 points. Each series
label (each cell in the first column of the data list) was given
the Optima Bold font and a size of 12 points. You might notice other
interesting attributes of this graph as well.
If we add text tags to an existing graph, the $dispose()
method must be executed to realize the effect. Depending on what
other changes may have been made, this may also need to be followed
by a redraw of some kind.
As with HTML, Graph2 tags can contain many more properties than
the common ones we have reviewed here. We can also inject them anywhere
within a Graph2 text value. So we can change font, size, color and
other attributes on a character-by-character basis within Graph2
if we feel the need to do so. We have the power to create some truly
ugly graphs!
Next Time
In the next issue of Omnis Tech News, we will return to our discussion
of Object Instances - specifically, the subject of Data Objects.
I hope you continue to find these articles useful.
|  Please logon or create a free account to download this file.


