- Set the Debug value to the full path to the jscomp folder in your Omnis app.
This section describes the process of debugging the C++ part of your JavaScript Component.
Make sure you set your build configuration to the UNICODE DebugWebDesign target.
Open your project's Properties.
Under General, set the Output Directory to the jscomp folder in your Omnis installation.
Under Debugging, set the Command to point to your omnis.exe (including the full path).
Start debugging (F5). Omnis will be launched with your new component, and any breakpoints in your code will be hit.
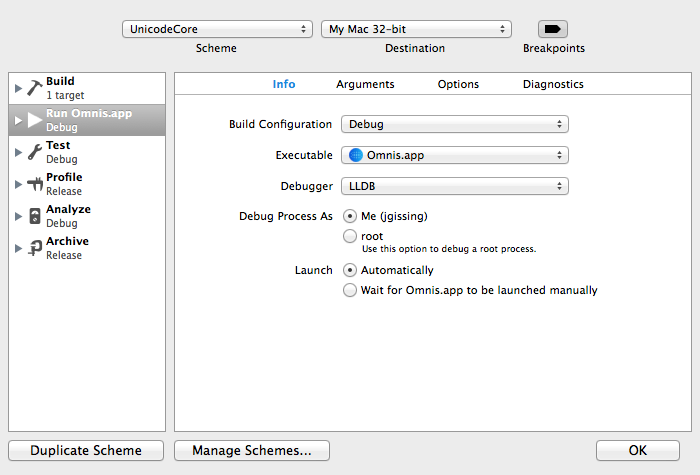
The first step in debugging an OS X component, is to edit the scheme.
Open the Product menu, and select Scheme > Edit Scheme.
Select the Run configuration, and open its Info tab.
Set its Executable to your Omnis app.
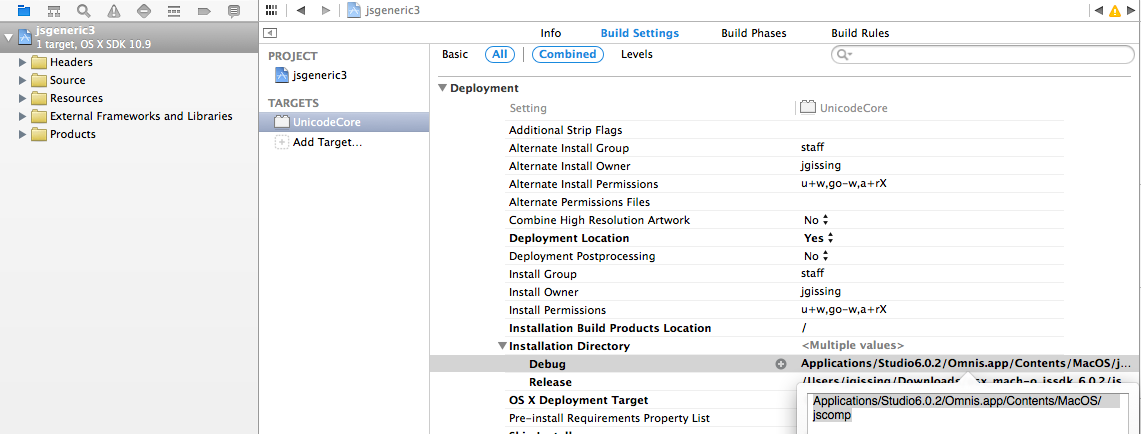
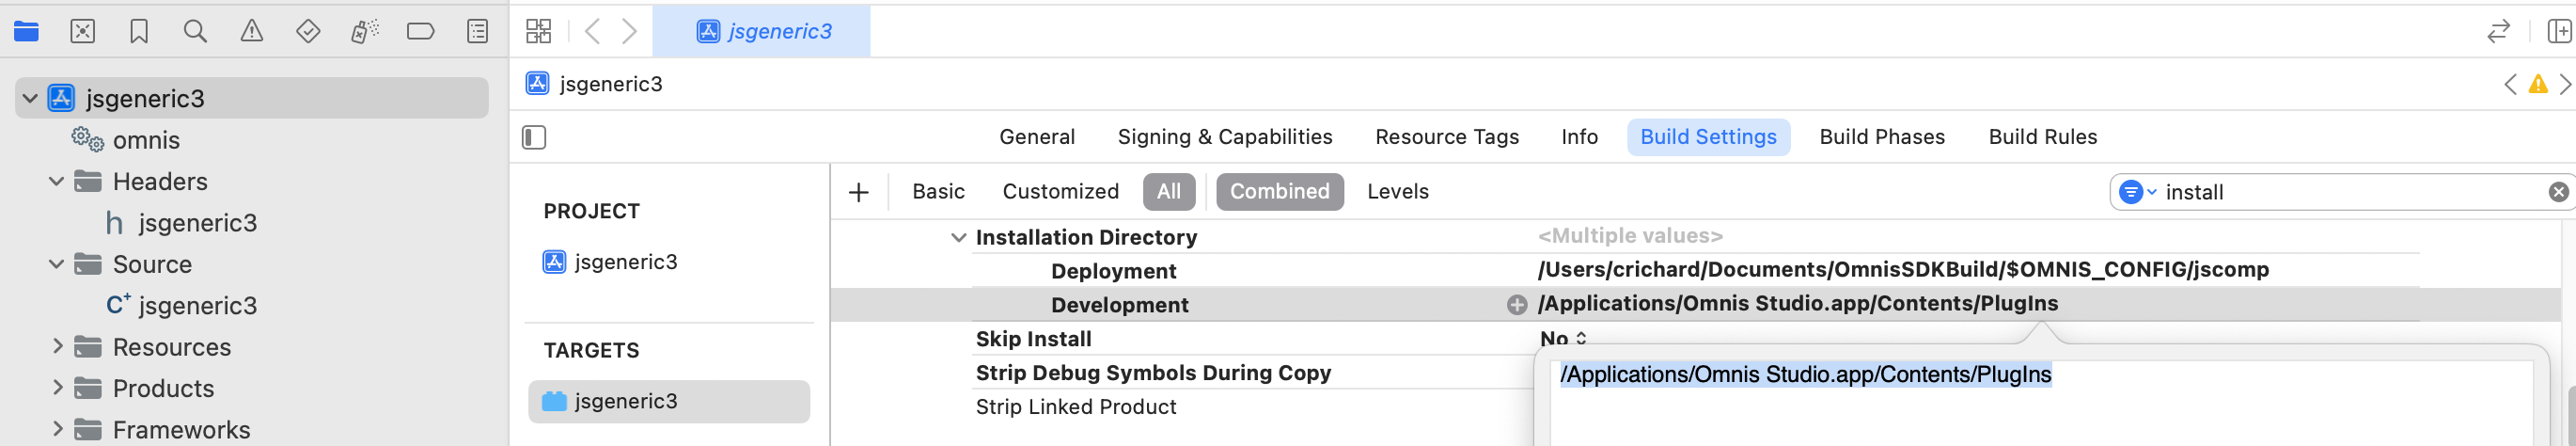
The next step is to make sure that your component is built into the Omnis tree.
Open the Build Settings in your project.
Locate the Installation Directory setting.
You can now Run your project. Omnis will be launched, and any breakpoints in your code will be hit.
This section gives a simple overview of debugging a JavaScript Control, the JavaScript part of your component.
In order to debug JavaScript code, you need to make use of the debugging tools in your browser. Most of the major browsers have their own implementation for this. This document is based on using Chrome (since its debugging tools are very good), but the principles hold true for all browsers.
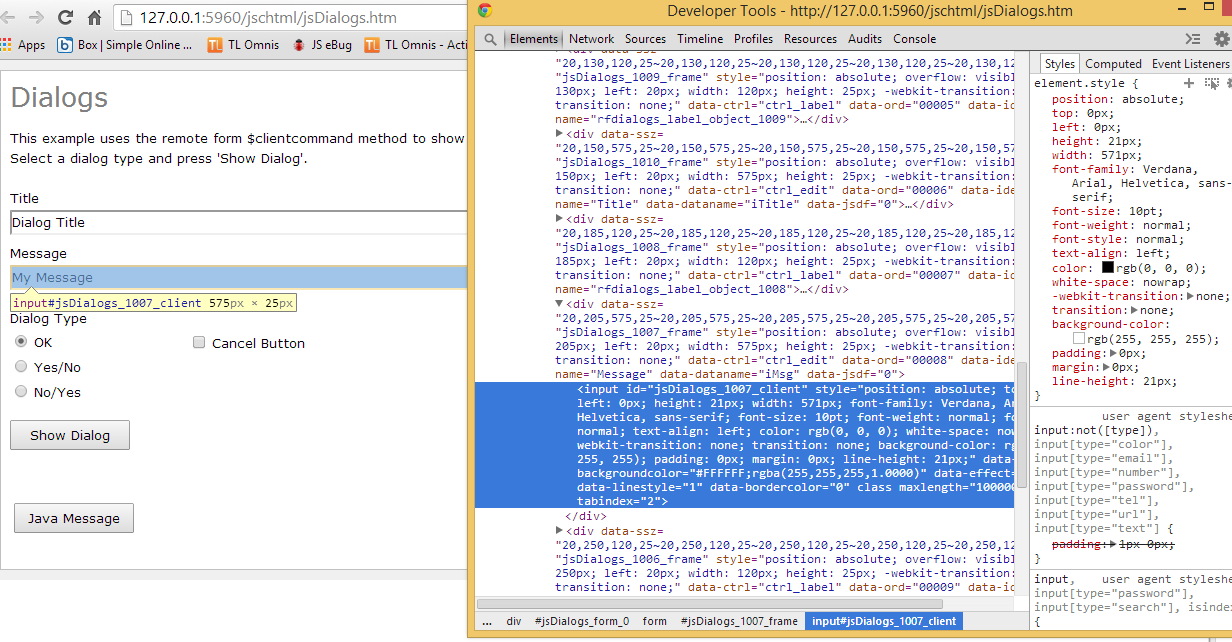
The first, and simplest, debugging procedure is to take a look at the structure of your control. This allows you to make sure that the elements are being constructed as you wish.
Load your Omnis form in Chrome, right-click an element on your form, and select Inspect Element. This will open the Developer Tools, and take you to the clicked element within the DOM.
Here you can inspect the HTML, to make sure that it is being constructed properly.
You can also make changes here on-the-fly, and see their effects immediately. This is very helpful in allowing you to work out exactly what attributes/styles, etc, you need to set in order to get your element to appear just as you want.
Another very useful debugging feature is the ability to step through your code.
Load your Omnis form in Chrome, then open the developer tools (F12 / Cmd-Alt-I). Alternatively you can right-click some element on the form and Inspect element.
Switch to the Sources tab, and select your .js file from the scripts folder shown in the source tree.
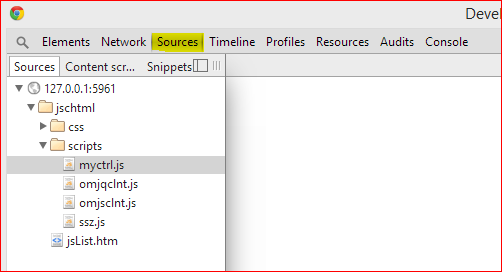
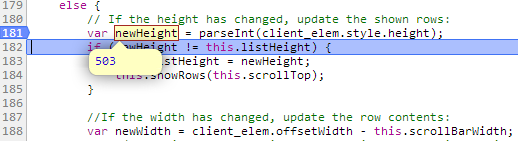
This will bring up your source code, and allow you to set breakpoints (by clicking in the margin).
When you hit a breakpoint, you can view the values of variables by simply hovering over them with the mouse, or in the developer tools sidebar.